• Welcome to the Chevereto user community!

    Here users from all over the world gather around to learn the latest about Chevereto and contribute with ideas to improve the software.

    Please keep in mind:

    • 😌 This community is user driven. Be polite with other users.
    • 👉 Is required to purchase a Chevereto license to participate in this community (doesn't apply to Pre-sales).
    • 💸 Purchase a Pro Subscription to get access to active software support and faster ticket response times.
  • Chevereto Support CLST

    Support response

    Support checklist

Increase in timeout errors

mkerala

👽 Chevereto Freak
Website URL
https://gifyu.com

Chevereto version
3.10.18

Description of the issue
I have recently started seeing an increase in timeout errors on my site. This is when doing a search or listing more than 250 images at once. Also when uploading more than 10 images some of it fails.

Usually, I do a PHP service restart or do a complete server reboot to fix. However, past few days it is repeating very often. If I am correct this issue started when the expire image setting kicked in early this month. Hence 1000s of images are deleted automatically every day.

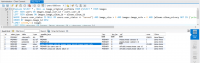
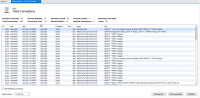
Nginx logs have several of below errors. However, PHP error log is clean without any entry for several days. CPU and RAM usage for the server is below 50%.

Code:
2018/08/22 10:05:30 [error] 1158#1158: *3202744 FastCGI sent in stderr: "PHP message: Request denied" while reading response header from upstream, client: 162.158.167.9, server: gifyu.com, request: "POST /json HTTP/1.1", upstream: "fastcgi://127.0.0.1:9000", host: "gifyu.com", referrer: "https://gifyu.com/"

I tried server fault and advise were to check PHP error logs which are empty in my case.

Could you point me in the right direction to investigate this further?
 
Could you point me in the right direction to investigate this further?

Sure, start here:
listing more than 250 images at once

The more items you list, the more you use the machine. Same goes to high image size max value, forced resizing jobs, etc. The more you use the machine the more machine/time will needed. Keep in mind that this is a kind of software that could be used by several peers at the same time, so anything you test solo won't be affected by the real life concurrency. Any subtle change in settings could lead to excessive load in your machine which either can't handle that load or you haven't configured your server properly or the script is faulty.

If the script is causing this you have to show me the bottleneck (the error line you posted is not enough). You have to show me a slowquery log, a peak, whatever that can help me to detect a potential script issue. I cannot do this for you. Sounds harsh, but the server running Chevereto is not my responsability neither is included in the Tech Support service.

Dig it further, try, test, at least give me a proof of case or something that connects this issue to Chevereto. Otherwise, this is just another server not optimized for the load you are expecting.

Start monitoring your server with something like https://www.monitorix.org/ so you can start knowing exactly how your server is being stressed, which times, which resources. Maybe is just a faulty disk, who knows.
 
As the timeout kept increasing I added fastcgi_read_timeout 150; to Nginx config. I know this doesn't necessarily fix the issue, but it solved the timeout for some time.

Then I noticed it is the database being slow to respond even though there was no slow query reported. But the database goes to stopped for a while and restart often. I added innodb_buffer_pool_size=3G which worsened the situation as the database took more time to restart and website going offline. Then I saw too many aborted connections, so I increased connections from 200 to 2000 and looks stable now. This is my current Maridb config

max_allowed_packet=500M
tmp_table_size=320M
max_heap_table_size=320M
max_connections=2000
innodb_log_file_size=128M
innodb_buffer_pool_instances=1
innodb_buffer_pool_size=2048M
join_buffer_size = 1M
table_open_cache = 16000
table_definition_cache = 16000
thread_cache_size=4
open_files_limit = 24000
query_cache_type = 1
query_cache_limit = 512K
query_cache_min_res_unit = 2k
query_cache_size = 128M
key_buffer_size=128M
performance_schema = ON
wait_timeout=90
max_user_connections=30
 
@rodolfo I came across this strange query being stuck at sending data for quite a while when my website started throwing internal server erorrs.

-- Connection Id: 243
-- User: *********
-- Host: *******
-- DB: ********
-- Command: Query
-- Time: 17
-- State: Sending data

SQL:
SELECT
    *,
    NULL AS image_original_exifdata
FROM
    (
        SELECT
            *
        FROM
            images
        LEFT JOIN users ON images.image_user_id = users.user_id
        LEFT JOIN albums ON images.image_album_id = albums.album_id
        WHERE
            (
                users.user_status IS NULL
                OR users.user_status <> "banned"
            )
        AND image_size > 0
        AND images.image_nsfw = 0
        AND (
            albums.album_privacy NOT IN (
                'private',
                'private_but_link',
                'password',
                'custom'
            )
            OR albums.album_privacy IS NULL
            OR albums.album_user_id IS NULL
        )
        ORDER BY
            images.image_id DESC
        LIMIT 126600,
        51
    ) images
LEFT JOIN storages ON images.image_storage_id = storages.storage_id
LEFT JOIN categories ON images.image_category_id = categories.category_id
ORDER BY
    images.image_id DESC
I had to kill this couple of times to bring the server back online. Seems to trigger again once in while, however now not taking too much time after I increased no: of connections.

1537078139977.png
This query seems to the one still slowing down my site. While this query executes all other queries have status "waiting for table level lock" and this triggers every 30 seconds or so and last for about 10-30 seconds each time or more.
 
Last edited by a moderator:
Thank you for your input. I have added index columns listed in the query except for image_original_exifdata. The results are as follows.

Query time (before indexing) = 255-300 seconds
Query time (after indexing) = <20 seconds

This has brought down the query time to 20-30 seconds instead of 255 seconds without indexing and my site is now up after hours of repeated downtime. Hope it is resolved for a foreseeable future.

However, this query is still taking too much time while other queries finish in like a second. I believe this might be due to below reasons.

1. Large table: My site has got around 2.3 million images and images table itself has over 3GB in size. Any operation like indexing or optimization takes around 10 minutes to complete.

2. Listing large no: of images: For moderation purpose, I change listing image to 250 or 500 and most issues crawl up during this time.

3. Too many Join operation across tables: I'm not an expert on SQL queries, but I feel there is too many join operation in this SQL query and when performed on a large table it will take time.

4. New external storage: This issue worsened around when I added a second external storage. I think this increased the time the query need to run due to "LEFT JOIN storages ON images.image_storage_id = storages.storage_id"

5. "Get rid of exif data before listing": I traced this query to classes_listing and the function for this query was to remove exif data before listing. Is this really required or can it be turned off somehow?

I was thinking if this query can be further optimized for faster performance.

Screenshot of EXPLAIN query attached.
 

Attachments

  • Annotation.png
    Annotation.png
    312.4 KB · Views: 11
I will get rid of the null casting exif, but I don't know what else to optimize as I can't get rid of the joins and is very likely that joins aren't the problem. As you may notice, Storages and Categories are included after the first sub-query.

You could try combining indexes so the engine doesn't need to lookup in several indexes, just one. Most likely the problem is just that.
 
Wow, this is truly amazing.

In fact it is a super efficient solution to use limit. At one point I was thinking to put execeution_timeout in the query, but that would only break the code. I am eager to test the new version, so placed the request for beta.

I'm very much excited this is now addressed as over the years my site has slowed down as it grow and I suspect the primary reason was this query. Now I don't see any queries that would take more than a second to execute that will slow the site.

PS: The query is running in 1.224 s because it seems to be cached after repeated runs. New values in queries still take around 20 seconds. Hopefully the new code eliminate the delay
 
The seek method significantly boosted my website performance and I don't see any query using more than a second time on database.
 
Last edited:
The issue seems to be back after the recent update. The below query is getting stuck at "sending data" for almost 8 mins locking the database down for other queries and bring the site down. See attached screenshot.

Code:
-- Connection Id: 2703
-- User: chevereto
-- Host: 192.168.1.3:34252
-- DB: gifyudb1
-- Command: Query
-- Time: 164
-- State: Sending data
SELECT * , NULL as image_original_exifdata FROM (SELECT * FROM images
LEFT JOIN albums ON images.image_album_id = albums.album_id
WHERE images.image_user_id='31174' AND image_size > 0 AND images.image_nsfw = 0 AND (albums.album_privacy NOT IN ('private','private_but_link','password','custom') OR albums.album_privacy IS NULL OR albums.album_user_id IS NULL)
ORDER BY images.image_id DESC
LIMIT 251) images
LEFT JOIN storages ON images.image_storage_id = storages.storage_id
LEFT JOIN users ON images.image_user_id = users.user_id
LEFT JOIN categories ON images.image_category_id = categories.category_id
ORDER BY images.image_id DESC

Unlike last time this is not triggered every minute, once in a while and stay longer than before. Last time indexing solved the issue for me. Not sure if update has removed the index.

I have now dumped the database and reloaded it. Also ran a full optimize. I will monitor and update if the query triggers again.
 

Attachments

  • 1537707552398.png
    1537707552398.png
    819.2 KB · Views: 3
The query triggered again. I could find "WHERE images.image_user_id='29763' " in the query which means this is getting triggered from a user profile/album.

Code:
-- Connection Id: 6330
-- User: chevereto
-- Host: 192.168.1.3:48518
-- DB: gifyudb1
-- Command: Query
-- Time: 105
-- State: Sending data
SELECT * , NULL as image_original_exifdata FROM (SELECT * FROM images
LEFT JOIN albums ON images.image_album_id = albums.album_id
WHERE images.image_user_id='29763' AND image_size > 0 AND images.image_nsfw = 0 AND (albums.album_privacy NOT IN ('private','private_but_link','password','custom') OR albums.album_privacy IS NULL OR albums.album_user_id IS NULL)
ORDER BY images.image_id DESC
LIMIT 251) images
LEFT JOIN storages ON images.image_storage_id = storages.storage_id
LEFT JOIN users ON images.image_user_id = users.user_id
LEFT JOIN categories ON images.image_category_id = categories.category_id
ORDER BY images.image_id DESC
 
The query is using the seek method, the issue must be a missing index somewhere.
 
Problem here is that the DB engine is not using the right index. Tested on MySQL 5.5.54-0ubuntu0.14.04.1 (demo) and 5.5.5-10.1.25-MariaDB-1 (yours).

A "fixed" query should look like this:
Code:
SELECT * , NULL as image_original_exifdata FROM (SELECT * FROM images USE INDEX(image_user_id)
LEFT JOIN albums ON images.image_album_id = albums.album_id
WHERE  images.image_user_id = '29763' AND image_size > 0 AND images.image_nsfw = 0 AND (albums.album_privacy NOT IN ('private','private_but_link','password','custom') OR albums.album_privacy IS NULL OR albums.album_user_id IS NULL)
ORDER BY images.image_id DESC
LIMIT 251) images
LEFT JOIN storages ON images.image_storage_id = storages.storage_id
LEFT JOIN users ON images.image_user_id = users.user_id
LEFT JOIN categories ON images.image_category_id = categories.category_id
ORDER BY images.image_id DESC
This query runs in just 0.205 s

1537720129028.png

When you don't force the index, you get this:

1537720210073.png

Thing is that at the demo I've almost the same MySQL setup but the index is detected automatically:

1537722554627.png

My bet is that the lack of a DB prefix causes the engine to don't automatically detect the right index. Being honest, I don't know if this is the real cause. Maybe is something else, but the thing is that your engine should use the right index without the need of USE INDEX keyword.
 
Ok, I will look into it.

Seems the query is getting fast after a while. Earlier it took 10 minutes to run and now down to just 7 seconds. I'm guessing that after a while DB contents gets cached to RAM and it runs subsequent queries faster. Let me see if I can fix the index issues.
 
I think I fixed this.

1537778532213.png

I got a hint from the explain screenshot posted above that my server was picking primary as 'key' instead of the index. I created a multi-column index with image_user_id at the top of the order. This seems to have fixed it.
 
Last edited:
Another issue I found was optimizer using wrong index. Too many index can cause the optimizer to pick the wrong one. I had to drop few index which then optimizer picked the right one.
 
Last edited:
I believe that you still don't realize that all your index problems were caused by you. Any normal installation shouldn't have any index issue at all. No one should tweak/change the indexes unless you know exactly what you are doing.
 
Back
Top